animating-alpha-and-beta
Making an animation of alpha and beta for given stocks with matplotlib.
| 日本語(Qiita) | haltaro |
Requirements
Data
You have to add Histrical Data such as GOOG.csv to /data directry. For example, YAHOO! FINANCE helps you.
- Access to the summary page of symbol (ex. google(
GOOG.csv)). - Click the
Histrical Dataat top of the page. - Make sure
Time Period:is the period you want, andFrequency:isDaily. Then clickDownload Data. - Rename the file if necessary (ex:
table.csvto `GOOG.c
python
- pandas and NumPy : For manipulating data. I used pandas 0.18.0 and NumPy 1.10.4
- matplotlib : For making animation. I used matplotlib 0.18.0.
Udacity
The codes depend on functions defined in Machine learning for trading at Udacity. Refer to the class (and take it!). You have to add udacity.py which defines get_data(), fill_missing_values(), and compute_daily_returns() to the current directry.
Model
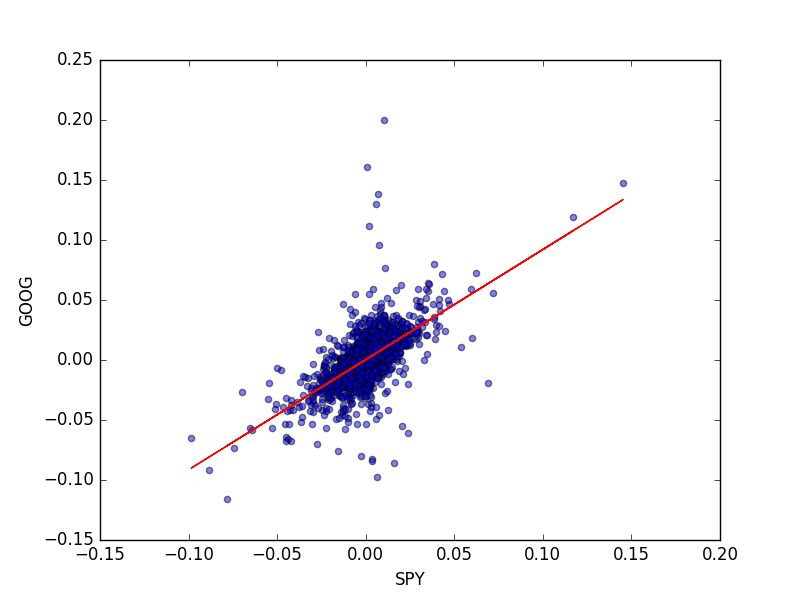
Hereinafter, we assume SPY as the benchmark. The figure shows daily-returns of SPY and GOOG from Dec. 1, 2006 to Dec. 1, 2016. The regression line can be defined as y = beta x + alpha.
- alpha: Intercept of the line. It can be considered as the return over the benchmark.
- beta: Slope of the line. It can be considered as the relative volatility.
How to use
import animab as ab

ab.animate_a_b()
Variables
symbols: List of symbols to animatestart_dateandend_date: Defines the animation period. Strings withyyyy-mm-ddformat.period: Calculation period of alpha and beta.
License
MIT